Thoughts on Collective Intelligence, Data Wrangling, Data Science, Predictive Modeling,Start-ups and a repository for ideas and things I hope not to forget
Showing posts with label Data Science. Show all posts
Wednesday, December 31, 2014
Friday, April 25, 2014
Zipfian Academy - All 12 weeks
Here you go.. a week to week summary of my experience at Zipfian Academy
Week 2 : Zipfian Academy - Are you Frequentist or Bayesian ?
Week 3 : Zipfian Academy - Multi-armed bandits and some Machine Learning
Week 4 : Zipfian Academy - Oh SQL, Oh SQL... MySQL and some NLP too
Week 5 : Zipfian Academy - Graphs and Community Detection
Week 6 : Zipfian Academy - The Elephant, the Pig, the Bee and other stories
Week 7 : Zipfian Academy - Advanced Machine Learning and Deep Learning
Week 8 : Zipfian Academy - Assessment and Review
Week 9 : Zipfian Academy - Personal projects
Week 10 : Zipfian Academy - Closing the loop ... rinse..repeat
Week 11 : Zipfian Academy -The Beginning of the End
Week 12 : Zipfian Academy - And That's All folks....
For a different point of view about the Zipfian experience do checkout another fellow alum - Melanie's blog All the Tech Things
Friday, April 18, 2014
Week 12 : Zipfian Academy - And That's All folks....
And so, all great things must come to an end. This is the final week for the bootcamp program. We continued interview prep, white boarding and code reviews. Apparently interviewing feels like having a full time job. Towards the end of the week, we continued with project one on ones, some more white boarding and interview prep, runtime and complexity analysis.
At the end of the week, we had a get together to celebrate the past the 12 weeks. A handful of alums from the last cohort attended and it's kind of cool to see what past alums are doing now.. some are at stealth startups and startups while others are working at some very impressive companies.
Highlights of the week:
And so this is it. My hope is that someone actually finds my ramblings over the past 12 weeks somewhat helpful in forging their own path into Data Science......signing off.
At the end of the week, we had a get together to celebrate the past the 12 weeks. A handful of alums from the last cohort attended and it's kind of cool to see what past alums are doing now.. some are at stealth startups and startups while others are working at some very impressive companies.
Highlights of the week:
- We had a guest lecture from former cosmologist and Data Scientist @datamusing on using topic models to understand restaurant reviews. The topics were learned from the review corpus using LDA and NNMF. He also had a pretty cool d3 + flask visualization to show the results
- We spent a day at the Big Data Innovation Summit. The morning talks mostly felt like business sales pitches. The afternoon talks were a lot more interesting as there were breakouts for Data Science, Machine Learning, Hadoop, etc
- In the Data Science breakouts, there were a lot of LDA related talks including using topic modeling in Health Care and using LDA to extract features for matches in a dating website.
- Lots of interview prep and white boarding
And so this is it. My hope is that someone actually finds my ramblings over the past 12 weeks somewhat helpful in forging their own path into Data Science......signing off.
Sunday, April 13, 2014
Slides from Project Presentation #How Will My Senator Vote?
Here are slides from my project presentation on analyzing How Senators vote in Congress and building a model to predict how they would vote on future bills
Saturday, April 12, 2014
Week 11 : Zipfian Academy -The Beginning of the End
We started the week wrapping things up with our personal projects, putting together decks for our Hiring Day presentations and doing mock runs of our presentations. Towards mid-week, we did more mock runs and put final touches on our presentation decks.
Hiring Data was pretty hectic. It started off with a short mixer with representatives from the various companies that attended. Each of the companies did a quick presentation on who they were and what they were looking for. Once that was done, we proceeded to presenting each of our projects taking a few questions from the audience at the end of each presentation. There were a lot of really cool projects.
After project presentations and lunch, we had "speed dating" sessions with each of the companies that attended. It was a couple of minutes introducing yourself to the company, hearing what they were looking for and seeing if there's a good fit. It was quite tiring going through 16 or so interviews in the span of two hours but it was a worthwhile experience.
Most of us spent the last day of the week cleaning up and refactoring our project code.
Project Next Steps : I do plan to continue working on my project down the line, making some more improvements to my pipeline, looking at new and richer data sources, asking more interesting questions and doing some more analysis to improve my prediction accuracy. There's still a lot of ground to cover here. I also plan to use Latent Dirichlet Allocation (LDA) to extract better features from my data as you can pull out really rich and interesting features from your data using topic modeling. My original model used a "bag of words" approach. The eventual goal would be to release this as a web app anyone could use.
Hiring Data was pretty hectic. It started off with a short mixer with representatives from the various companies that attended. Each of the companies did a quick presentation on who they were and what they were looking for. Once that was done, we proceeded to presenting each of our projects taking a few questions from the audience at the end of each presentation. There were a lot of really cool projects.
After project presentations and lunch, we had "speed dating" sessions with each of the companies that attended. It was a couple of minutes introducing yourself to the company, hearing what they were looking for and seeing if there's a good fit. It was quite tiring going through 16 or so interviews in the span of two hours but it was a worthwhile experience.
Most of us spent the last day of the week cleaning up and refactoring our project code.
Project Next Steps : I do plan to continue working on my project down the line, making some more improvements to my pipeline, looking at new and richer data sources, asking more interesting questions and doing some more analysis to improve my prediction accuracy. There's still a lot of ground to cover here. I also plan to use Latent Dirichlet Allocation (LDA) to extract better features from my data as you can pull out really rich and interesting features from your data using topic modeling. My original model used a "bag of words" approach. The eventual goal would be to release this as a web app anyone could use.
Highlights from the week:
- We started the week with a guest lecture from @itsthomson. He is the founder of framed.io. He just finished the YC program and had lots of words of wisdom. He walked us through his experience making the transition from academia to Data Science, moving to a Chief Scientist role and now Founder. It's refreshing to hear from someone that has gone through the process. Some quotes from his lecture : "Data is the most offensive (vs defense) resource a company has",.. "In Data Science, you have to know a little of everything",.."Being technical helps, but being convincing is better",.. "Understanding how your analysis ties back to your business / organization is key"
- We attended a Data Science for Social Good panel event at TaggedHQ. The panelist included CTO - Code for America, CEO - Lumiata, Data Scientist - BrightBytes, Data Scientist - OPower and Lead Data Scientist - Change.org. These companies are utilizing data science to make a difference. It was a very insightful panel session.
- Hiring Day was rather interesting. 16 companies attended. The companies came from different verticals including CRM, consulting, social good, social, health, payments, real estate, education and infrastructure. It was interesting hearing some of the problems they were trying to solve in their respective domains
Saturday, April 5, 2014
Week 10 : Zipfian Academy - Closing the loop ... rinse..repeat
Continued working on my personal project and was glad my data ingestion and aggregation pipeline was built and optimized.
Analysis : Now that I had most of the data I needed, the next step was trying the close the loop as soon as possible, get some predictions for each Senator and then iterate. One challenge was trying the find signals that indicated uniqueness just from voting patterns and the content of the bills. As part of my analysis, I used techniques like MDS, clustering and NLP to extract salient features from my initial dataset. I did find out from my analysis that over the past 3.5 years, Democrats are more predictable and are more alike than Republicans based on just their voting patterns.
Modeling : I started off with a Naive bag of words model and got an average prediction accuracy in the low 60's. I went back and did some chi-squared feature selection, natural language processing (tfidf, n-grams, stop-words, stemming, binning, lemmatization, etc...), grid search and cross-validation on a pipeline of models (Logistic Regression, Random Forest, SVM, AdaBoost, Naive Bayes, kNN) and added some social data from wikipedia and twitter. This improved my average prediction accuracy to the high 60's. Moving forward, there's still a lot of ground to cover here. I can probably get this to low 80's on average prediction accuracy across all the Senators in congress The biggest take away here is to spend time and lots of it understanding your dataset, crafting better features and adding external data that would give additional insights or increase the richness of your data. The modeling part can be automated but your models can only be as good as the data you feed them.
At this point, we're all seeing the light at the end of the tunnel. I gave a top level overview of my project. I'm working on putting up a Github repo with a more in-depth version.
Highlights from the week:
Analysis : Now that I had most of the data I needed, the next step was trying the close the loop as soon as possible, get some predictions for each Senator and then iterate. One challenge was trying the find signals that indicated uniqueness just from voting patterns and the content of the bills. As part of my analysis, I used techniques like MDS, clustering and NLP to extract salient features from my initial dataset. I did find out from my analysis that over the past 3.5 years, Democrats are more predictable and are more alike than Republicans based on just their voting patterns.
Modeling : I started off with a Naive bag of words model and got an average prediction accuracy in the low 60's. I went back and did some chi-squared feature selection, natural language processing (tfidf, n-grams, stop-words, stemming, binning, lemmatization, etc...), grid search and cross-validation on a pipeline of models (Logistic Regression, Random Forest, SVM, AdaBoost, Naive Bayes, kNN) and added some social data from wikipedia and twitter. This improved my average prediction accuracy to the high 60's. Moving forward, there's still a lot of ground to cover here. I can probably get this to low 80's on average prediction accuracy across all the Senators in congress The biggest take away here is to spend time and lots of it understanding your dataset, crafting better features and adding external data that would give additional insights or increase the richness of your data. The modeling part can be automated but your models can only be as good as the data you feed them.
At this point, we're all seeing the light at the end of the tunnel. I gave a top level overview of my project. I'm working on putting up a Github repo with a more in-depth version.
Highlights from the week:
- We had a guest lecture from @WibiData on building real-time recommendation engines at scale with kiji. The kiji platform seems pretty mature and has support for quite a few languages and connectors to several Big Data frameworks. Evaluating recommender engines has always been a problem. One approach is to perform validation on a hold out sample of your data.
- We also had another pretty interesting guest lecture from @maebert. They've built an automatic journaling tool. They built a data product out all the ambient data (passively generated data) we generate by triangulating your position using GPS signals and cell phone towers. They use those data points to tell a story about you. Their pipeline looks something like this (Signals -> Data -> Information -> Knowledge -> Stories). It's actually quite cool how patterns start to emerge when you look at aggregate data. I guess we all know a little something about that from the "revelations" that happened last summer. They utilize techniques like LSA / LDA/ SVD to extract concepts and their weights, expectation maximization (Gaussian mean shift) and some NLP. They try to see if the concepts change over time and also try to enrich their datasets using external feeds for weather data, events data, ticketing, etc
- We had breakouts on presentations. We worked on our projects for two weeks and trying to bottle all that work into a three minute presentation won't do it justice. So you'd want to answer the following questions to give the audience enough to spark some interest - What?, Why?, How?, So What?, Next Steps?
Friday, March 28, 2014
Week 9 : Zipfian Academy - Personal projects
This is a little late, so I'll try and make this quick. Personal projects began this week and we'll be working on them for another week. My project is focused on modeling Senators' past voting patterns and using that to predict how they'll vote on future legislation and whether bills pass or not.
Data Acquisition : I initially planned to source my data using APIs from The Sunlight Foundation and Votesmart but realized quickly things might take much longer with the APIs since I needed several different datasets and also needed a way to aggregate all the data. I decided it would be more optimal to go straight to the source: US Senate website. Setting up and debugging my data ingestion pipeline took another two days and by the end of the week I had all the data I needed..scraped, cleaned and packaged nicely in a database and several python pickle objects.
Data Transformation : Getting the data is one thing and transforming it to get it ready for analysis and modeling is another. Most Data Scientist tend to spend a lot of project time cleaning, aggregating and transforming data.
Highlights from the week:
Data Acquisition : I initially planned to source my data using APIs from The Sunlight Foundation and Votesmart but realized quickly things might take much longer with the APIs since I needed several different datasets and also needed a way to aggregate all the data. I decided it would be more optimal to go straight to the source: US Senate website. Setting up and debugging my data ingestion pipeline took another two days and by the end of the week I had all the data I needed..scraped, cleaned and packaged nicely in a database and several python pickle objects.
Data Transformation : Getting the data is one thing and transforming it to get it ready for analysis and modeling is another. Most Data Scientist tend to spend a lot of project time cleaning, aggregating and transforming data.
Highlights from the week:
- Got a chance to attend a meetup organized by BaRUG (Bay Area R Users Group). There was a talk from the author of the caret package (this is kind of the R version of scikit-learn) and another from the Human Rights Data Analysis Group - they use R to build statistical models to work on human rights projects across the globe.
- We had a guest talk from a former physicist who is now a Data Scientist @WalmartLabs. He works with a group that deals with algorithmic business optimization. The talk was actually quite insightful as he touched on some interesting pain points.."reconciling technical and business needs "..."The simpler the model the better"
- We also had another guest lecture on visualization. The speaker also worked on this awesome visualization of BART employee salaries
- Several of us attended a D3 workshop organized by the VUDlab at UC Berkeley
Monday, March 17, 2014
Week 8 : Zipfian Academy - Assessment and Review
This is the last week for the structured part of the curriculum....moving forward, it's projects, hiring day and interviews.
We started the week by reviewing material from the first three weeks : Statistics, distributions, hypothesis testing, Bayesian A/B testing and different distance metrics (jaccard, euclidean, hamming, cosine) and then we moved to reviewing material from the second four weeks : web scraping with beautifulsoup and Naive Bayes. We had a breakout on advanced web scraping with scrappy and mechanize. You use these advanced tools when you have complex scraping requirements like javascript loading, pagination, etc. Tools like kimono and import.io were also introduced. These tools can be a lifesaver especially when you're working on a tight schedule.
By midweek, we reviewed some of the material we covered earlier : more Naive Bayes. regression and outliers. Next day, we worked on an assessment. It was an NLP classification problem from one of our partner companies. The dataset was fairly small and the problem was well defined. Things got a bit interesting when I tried doing "extensive" grid search and cross validation on a pipeline of different models. It took more than 12 hours to go through one model.... this is where you either push things to a beefy machine on AWS or perform a randomized grid search to help you find the best hyperparameters for your model. We also reviewed sample interview problems.
We finished off the week with another assessment. This was more involved and had a few parts to it : some data wrangling of machine generated log data for a video content site, classification, regression, clustering and building a recommendation engine. It really feels like things are winding down as we move to personal projects next week.
Highlights from the week:
- We had a guest lecture from @enjalot. He's working on the bleeding edge of data visualization. Some of the things he's worked on include this visualization of BART employee salaries that made the rounds during the BART strike
Monday, March 10, 2014
Week 7 : Zipfian Academy - Advanced Machine Learning and Deep Learning
The week started with a detour into more advanced machine learning algorithms. We covered Logistic Regression, SVM, Naive Bayes and $k-$Nearest Neighbors. We compared these algorithms on several datasets to see which situations one would perform better than the other. Before now, I usually pick my favorite algorithms and apply them on a datasets - that's the wrong way to approach things. You need to be more strategic in choosing which algorithm you use (Use the right tool for the job). Machine learning algorithms are broadly classified as either generative or discriminative and you have MCMC (generative) and Neural Networks (discriminative) at the opposite ends of this spectrum respectively.
Next day, we moved to Decision Trees, Random Forest and ensembles We used BigML to visualize decision trees and i must say they have one of the best visualizations for Decision Trees. It comes in pretty handy when you're just doing EDA. Building Decision Trees can be slow and prone to over fitting but Random Forest solves a lot of these issues as the modeling process can be parallelized. They also tend to give you models with low bias and variance.
By mid-week, we delved into Deep Learning and built a Deep Belief Network using this library with several hidden layers (Restricted Boltzmann Machines) to classify digits from the popular MNIST dtataset. We had a feed-forward setup with no back propagation. Neural Networks have been around for a while but they were put back on the map with the advent of Deep Learning about a decade ago. In academic circles, most of the hottest Deep Learning research is going on at places like NYU/Facebook (Yann LeCun), Toronto/Google (Geoff Hinton), Montreal (Yoshua Bengio) and Stanford/Google (Andrew Ng) (..of course, not listed in order)
Towards the end of the week, we took another detour into time series analysis and worked on some trend and seasonality analysis using pandas. Friday was more of a catchup day. There were no official sprints. We worked on project proposals and had a Deep Learning and git breakout. We're slowing nearing the end of the structured curriculum and everyone is slowly moving into project mode. I'll say, there were a lot of 'aha' moments for me this week.
Highlights of the week:
Next day, we moved to Decision Trees, Random Forest and ensembles We used BigML to visualize decision trees and i must say they have one of the best visualizations for Decision Trees. It comes in pretty handy when you're just doing EDA. Building Decision Trees can be slow and prone to over fitting but Random Forest solves a lot of these issues as the modeling process can be parallelized. They also tend to give you models with low bias and variance.
By mid-week, we delved into Deep Learning and built a Deep Belief Network using this library with several hidden layers (Restricted Boltzmann Machines) to classify digits from the popular MNIST dtataset. We had a feed-forward setup with no back propagation. Neural Networks have been around for a while but they were put back on the map with the advent of Deep Learning about a decade ago. In academic circles, most of the hottest Deep Learning research is going on at places like NYU/Facebook (Yann LeCun), Toronto/Google (Geoff Hinton), Montreal (Yoshua Bengio) and Stanford/Google (Andrew Ng) (..of course, not listed in order)
Towards the end of the week, we took another detour into time series analysis and worked on some trend and seasonality analysis using pandas. Friday was more of a catchup day. There were no official sprints. We worked on project proposals and had a Deep Learning and git breakout. We're slowing nearing the end of the structured curriculum and everyone is slowly moving into project mode. I'll say, there were a lot of 'aha' moments for me this week.
Highlights of the week:
- We had a guest lecture from Allen on multi-layer perceptrons. He talked about some of the interesting research he worked on at Nike and how they used Neural Networks and other machine learning tools to design better footwear.
- Chief Data Scientist at @Personagraph gave an interesting lecture on how they're using machine learning
- We closed out the busy week with a Mentor Mixer. A lot of industry practitioners attended. The goal was to match current students with practicing Data Scientists. There were a variety of mentors who showed up, mostly Data Scientists, some Chief Data Scientists and a two-time Kaggle Competition Winner (yes, they are a rare breed but they do exist)
Saturday, March 1, 2014
Week 6 : Zipfian Academy - The Elephant, the Pig, the Bee and other stories
So this week was one heck of a week. We started Data Engineering and Data at Scale, had several guest lectures and played with some really cool tools. I got the RAM kit I ordered over the weekend, so it was nice starting the week running on 16gb of RAM. You could easily wrangle a few gigs of data locally without resorting to AWS or mmap tricks.
Okay, this post is going to be a long one. The events here are in chronological order.
The week started off with a quick assessment. We are getting to the end of the structured part of the curriculum, so this really helped pinpoint some areas and topics to revisit. The day officially started with an introduction to Hadoop, Hadoop Streaming and the map-reduce framework via mrjob. We wrote map-reduce jobs to do word counts. MapReduce framework / Hadoop easily made its way into mainstream because people realized they could now store massive amounts of data (terabytes -> petabytes) on a bunch of commodity nodes and also perform computation on those nodes. Of course Google also had a hand in this after they published their celebrated Map Reduce paper back in 2004. They seem to be years ahead of everyone else.
The next day, we worked on a more interesting problem using mrjob to do recommendations at scale by building a scaled down version of LinkedIn's People You May Know. We developed a multi-step map-reduce program with mrjob to analyze a social graph of friends and then performed Triadic closure to recommend new friends. So basically, if A knows B and A knows C, then to some degree B and C should also be friends.
Next day, we moved on to using Hive to build a contextualized ads server on AWS. Tools like Hive and Pig (which both have SQL-like syntax) are used to query data on Hadoop / Distributed File Systems and they both compile down to map-reduce. These tools were developed to cater to the audience that was already familiar with SQL but were not Java experts. We also discussed some of the next generation frameworks like Spark (in-memory), Impala (in-memory), Storm (real-time), Giraph (graphs), Flume (streaming-log files), etc.
After the first few days working with data at scale, we moved in a different direction to building data products with Flask and yHat . Using these tools basically opens the flood gates for data products. If you can build a predictive model in python or R, you can push it to production or to a client with minimal plumbing.
We wrapped up the week discussing project proposals, doing reviews, a breakout on Deep Learning and catching up on sprints. I ended up exploring a bunch of APIs from some non-profits. I was impressed some of them would build APIs to let people access their data and other government data.
Highlights of the week:
Okay, this post is going to be a long one. The events here are in chronological order.
The week started off with a quick assessment. We are getting to the end of the structured part of the curriculum, so this really helped pinpoint some areas and topics to revisit. The day officially started with an introduction to Hadoop, Hadoop Streaming and the map-reduce framework via mrjob. We wrote map-reduce jobs to do word counts. MapReduce framework / Hadoop easily made its way into mainstream because people realized they could now store massive amounts of data (terabytes -> petabytes) on a bunch of commodity nodes and also perform computation on those nodes. Of course Google also had a hand in this after they published their celebrated Map Reduce paper back in 2004. They seem to be years ahead of everyone else.
The next day, we worked on a more interesting problem using mrjob to do recommendations at scale by building a scaled down version of LinkedIn's People You May Know. We developed a multi-step map-reduce program with mrjob to analyze a social graph of friends and then performed Triadic closure to recommend new friends. So basically, if A knows B and A knows C, then to some degree B and C should also be friends.
Next day, we moved on to using Hive to build a contextualized ads server on AWS. Tools like Hive and Pig (which both have SQL-like syntax) are used to query data on Hadoop / Distributed File Systems and they both compile down to map-reduce. These tools were developed to cater to the audience that was already familiar with SQL but were not Java experts. We also discussed some of the next generation frameworks like Spark (in-memory), Impala (in-memory), Storm (real-time), Giraph (graphs), Flume (streaming-log files), etc.
After the first few days working with data at scale, we moved in a different direction to building data products with Flask and yHat . Using these tools basically opens the flood gates for data products. If you can build a predictive model in python or R, you can push it to production or to a client with minimal plumbing.
We wrapped up the week discussing project proposals, doing reviews, a breakout on Deep Learning and catching up on sprints. I ended up exploring a bunch of APIs from some non-profits. I was impressed some of them would build APIs to let people access their data and other government data.
Highlights of the week:
- A lot happened this week, we started out with a guest lecture with Dennis from @IdleGames. He gave his point of view from being in a Data Scientist role for the past year. A few quotes from the talk : "if you can't explain your analysis, it didn't happen!!", "Remove yourself as the bottleneck and automate everything". He's working on some interesting projects like churn prediction, integrating offline analysis into live games, collusion detection, customer long term value (LTV) and the uncertainty associated with that and also building out data products to democratize insights.
- I had a chance to attend a meetup hosted by Microsoft. There were two talks at this meetup. Setting up and running Hadoop on Cloudera and a more hands on intro to using F# for machine learning. It's not everyday the words 'open source' and 'Microsoft' show up in the same sentence, but I was really impressed with how expressive the language was and did I say it was open source and multi-platform? There was a really nice demo and I liked the F# type providers. One of the great things about the Bay Area is that on any given day, there are at least a handful of pretty good Tech meetups with very interesting topics and speakers.
- Tuesday, we had another guest lecture with Tyler from @radius. He's a Data Engineer who uses mrjob daily to write map-reduce jobs. He went through some detailed examples and sample code. It's really cool how mrjob handles a lot of plumbing around writing map-reduce jobs. You can run your code locally and also push it up to an Amazon Elastic MapReduce cluster with minimal changes.
- Next day, we attended another meetup hosted at YelpHQ. There were two very good presentations from @bigmlcom on doing exploratory data analysis / modeling and @YhatHQ on productionizing your python and R models. BigML has some cool features for getting a feel for your data and some pretty cool model visualizations. They focus mainly on decision trees and random forest ensembles. BigML's tool also let you download your models either in pseudo-code or in a variety of languages like python, R, Java, etc. yHat is a glue between the analytics stack and engineering stack. They also enable Data Scientists to be more productive by letting them push out their models to production via a REST streaming API with a json end point. I actually wrote about both startups a few months ago here.
- The co-founders of @YhatHQ dropped by the 'Data Warehouse' and gave a nice demo of a beer recommender service built with yHat and Flask. Greg was very helpful in working us through some of the issues we had setting things up.
- We had a special guest this week, @nathanmarz. He's a former Twitter Engineer and creator of Storm and Cascalog. His talk was half technical (overview of Clojure) and half philosophical (thoughts on where things are headed in the Big Data ecosystem). He reiterated the concept of doing your data analysis by building abstractions. I have to say, it is truly inspiring watching a Master at work.
- Our last guest lecture of week was by Nick from @DominoDataLab. They've built a Heroku for Data Science. Domino takes care of solving technical infrastructure problem like spinning up clusters, etc and lets you focus on Data Science. Their tool provides version control for your models / data, group collaboration, cron flexibility, etc
Labels:
AWS,
bigml,
data bootcamp,
Data Science,
DominoDataLabs,
Flask,
Hadoop,
Hive,
immersive learning,
machine learning,
mrjob,
PIg,
PYMK,
Storm,
yhat
Sunday, February 23, 2014
Week 5 : Zipfian Academy - Graphs and Community Detection
The update for last week will be short and quick. Doing these blog posts is getting much harder.
We started the week looking at unsupervised learning techniques like k-means and hierarchical clustering. We also visited dimension reduction techniques like SVD and NMF. By mid-week, we switched gears to graph analysis and covered in no particular order BFS, DFS, A*, Dijkstra and community detection in graph networks
Take aways from the week:
We started the week looking at unsupervised learning techniques like k-means and hierarchical clustering. We also visited dimension reduction techniques like SVD and NMF. By mid-week, we switched gears to graph analysis and covered in no particular order BFS, DFS, A*, Dijkstra and community detection in graph networks
Take aways from the week:
- We had several guest lectures this week. @kanjoya is working on the cutting edge of Natural Language Processing. They help their clients derive actionable intelligence from emotions and intuition. The speaker discussed the general NLP landscape : tools and techniques. I found it interesting that some of their training data comes from The Experience Project
- @geli gave an interesting talk. They've basically built an OS for energy systems and hope to revolutionize the energy management space
- @thomaslevine talk was on open data initiatives around the country. Open Data is one of those things cities like to talk about but very few of them are doing it well
- Things were switched around this week. We ended the week working on a dataset from one of the partner companies. The dataset recorded mobile ads served to user at various locations, we were supposed to do some exploration and find out the best locations to serve ads to users. The dataset had a couple million records. Trying to wrangle giga-byte sized data on just 4gb of RAM is definitely not fun. I ordered a 16gb RAM kit, should get it by this weekend. If you are thinking of enrolling for the course, you should shoot for at least 8gb of RAM.
Saturday, February 15, 2014
Week 4 : Zipfian Academy - Oh SQL, Oh SQL... MySQL and some NLP too
So things were totally ramped up this week. We started out by scrapping, parsing and cleaning data from the NYTimes API and then jsonified and stored the data in MongoDB. The next day we used the same dataset ported to a few SQL tables and implemented the Naive Bayes algorithm in SQL to classify which labels an article would fall under. We continued with some diagnostics like confusion matrix , confusion tables, false alarm rate, hit rate, precision, recall, ROC curves, etc. Other topics covered include NLTK, tokenization, TF-IDF, n-grams, regular expressions, feature selection using Chi-Squared and Mutual Information. We ended the week by working on another past Kaggle Competition - StumbleUpon Evergreen Classification Challenge
We are at the half way point for the structured part of the class. Just in case you're thinking of doing this, my schedule these days is about 12 - 15 hrs / day during the week doing daily sprints (data scrubbing , transformation / machine learning challenges), reading data science materials and lectures. Over the weekend, I'd say about 10 hrs / day closing the loop on a few of the sprints from the current week and doing more data science / readings for the following week. You basically live and breathe data science... all day long..all week long
Highlights from the week :
We are at the half way point for the structured part of the class. Just in case you're thinking of doing this, my schedule these days is about 12 - 15 hrs / day during the week doing daily sprints (data scrubbing , transformation / machine learning challenges), reading data science materials and lectures. Over the weekend, I'd say about 10 hrs / day closing the loop on a few of the sprints from the current week and doing more data science / readings for the following week. You basically live and breathe data science... all day long..all week long
Highlights from the week :
- We had two guest lectures this week. They were on Naive Bayes and feature extraction in NLP. Zipfian also added a guest lecturer to their roster. The new instructor is a Deep Learning expert and I'm really excited to explore working on new datasets with Neural Networks.
- Implementing things from first principles gives you a better understanding of how some of these algorithms work and what may be going on under the hood when they fail.
- My team also took the top spot in the Kaggle competition for the second week. The problem we worked on was a classification problem using AUC (Area Under the Curve) as the evaluation metric. We achieved an AUC of $\approx 0.8895$ which is about 0.008 off the leading Kaggle submission on the public leaderboard
- Cross-validating on your training set is always a good idea
Saturday, February 8, 2014
Week 3 : Zipfian Academy - Multi-armed bandits and some Machine Learning
We started the week by finishing off the session on Bayesian Statistics with the study of Bayesian A/B Testing techniques. Some of the strategies covered are extensions of the Multi-armed Bandit problem : epsilon greedy, Bayesian Bandits and UCB1. These algorithms typically out perform traditional A/B testing. We officially started machine learning this week with the treatment of linear regression, multiple linear regression, hetero/homo-scedasticity and multicolinearity. Other topics we covered include Lasso / Ridge regression, cross-validation , over fitting, bias / variance and Gradient Descent. We capped off the week by working on data from one of the past Kaggle competitions - Blue Book for Bulldozers
A few take aways from this week:
- There were a few algorithms I had always sort of understood. Some of these algorithms become very clear once you implement them from first principles and then apply them on a dataset. We implemented a Gradient Descent function and then used it to minimize the cost function of both linear and logistic regression problems ( I'll probably have a more detailed blog post on this). Working on some regularization with Lasso and Ridge also gave a better understand on how they both work
- We had a visit from @StreetLightData .Very cool problem they're working on. They essentially model mini migration patterns in cities / across the country. They feed data from cell signals, GPS, Census Data (Demographics / Geo) and Traffic data into their systems to extract insights used for marketing and planning
- Always remember 80-20. Data scientists spend 80% of their time cleaning datasets and extracting features (or at least more than half their time) and about 20% of their time doing modeling and parameter tuning. Forget those datasets you used in Stats class, real world data can be real messy
- $k-fold$ Cross-validation helps you prevent over fitting, get an estimate for your prediction error and helps you understand how stable / robust your model is
where MSE is Mean Squared Error$$CV_{(k)} = \frac{1}{k}\sum_{i=1}^k MSE_{i}$$
- My team took the top spot in the Kaggle competition we worked on. We had an RMSLE (Root Mean Squared Log Error) of $\approx 0.43$ which is about $0.2$ off the winning Kaggle submission. Decent for a few hours of work. It does look like working on Kaggle competitions may become a mainstay / regular end of week exercise
Week 2 : Zipfian Academy - Are you Frequentist or Bayesian ?
We started the week with a tour de force of matplotlib and then switched gears to Statistics. For the rest of the week, we covered Hypothesis Testing, Goodness of Fit (Kolmogorov Smirnov Test), Distributions, Confidence Intervals, p-values, t-tests, Frequentist A/B vs Bayesian A/B testing, MCMC
A few notes from this week:
- There's a huge debate on the Frequentist vs Bayesian schools of thought with proponents on both sides. Just in case you're on the fence here's an Open Letter on why you should think about going Bayesian
- The goal in Bayesian inference is to get a good handle on the posterior distribution over the input parameters. Some of the math can get pretty beefy so you would normally use a package like pymc or rjags to fit you distributions / models. Some good resources for pymc and MCMC are this Stats Book for Hackers and this set of videos from mathematicalmonk
- Some EDA (Exploratory Data Analysis) tools you should have in your workflow include Raw and CartoDB
- We had two pretty good talks by @nitin on LearnDataScience and @Udacity on their Data Science course development at one of the local meetup groups
Tuesday, January 28, 2014
Week 1 : Zipfian Academy - Priming the Pump , some Unix shell, python, recommenders and data wrangling
So things got off to a speedy start for the Zipfian Academy winter cohort. I think this first week was used to establish a pace for the course and it was intense. We probably spent about 8 - 10 hours a day on lectures / sprints and working on problems. I would imagine some folks probably spent a few more hours working on code / readings when they got back home.
For the first week, we covered the following in no particular order : overview of probability , Git / Github, some Bayesian Statistics, Bash / Unix shell, python, pdb, ipython, TDD, OOP, SVD, matrix factorization, overview of Linear Algebra and built a recommender system based on a large Amazon dataset
A few interesting themes I noticed
For the first week, we covered the following in no particular order : overview of probability , Git / Github, some Bayesian Statistics, Bash / Unix shell, python, pdb, ipython, TDD, OOP, SVD, matrix factorization, overview of Linear Algebra and built a recommender system based on a large Amazon dataset
A few interesting themes I noticed
- Pair programming is woven into the fabric of the program. We'll be pair programming for the first few weeks and will break off after about the first month or so. It does take a lot of getting used to especially if you haven't done it before or not used to it.
- Git / Github which is probably the standard version control tool at most tech shops is also tightly integrated into the program. From the first day, we were expected to fork repos and also push and pull code.
- Emergence of ipython as a truly awesome collaborative tool for data analysis. If you do python and you haven't used ipython and ipython notebooks, please stop reading this blog post and google them, you'll thank me.. seriously.
- The ever powerful and omni-present Bash and Unix command line. Every now and then, you're reminded how powerful these tools are for data analysis and data pipelining tasks.
- It is amazing how much you can learn by osmosis when you find yourself immersed in a collaborative environment with very like-minded colleagues.
- In thinking like a Data Scientist, your mind always has to be on the business problem you're trying to solve. It's not always about running the fastest or most exciting machine learning algorithm.
Thursday, September 19, 2013
9 Major Tasks in Data Science
Most problems in Data Science can be grouped under these 9 broad tasks. Of course some problems can also be classified under one or more of these tasks.
- Classification (Class probability estimation)
- Regression (Numerical value estimation)
- Similarity Matching (Recommendation systems)
- Clustering
- Co-occurrence grouping (Market basket analysis or associative rule mining)
- Profiling
- Link Prediction (Graphs or networks)
- Data Reduction (Dimensionality Reduction : PCA, SVD, Factor Analysis)
- Casual Modeling (Cause and effect pairs or groups)
Monday, August 26, 2013
Machine Learning as a Service
There are a couple of start-ups working on delivering machine learning as a service. Some of these solutions provide a turn-key data science environment : some data prep, munging, models, predictions and visualizations
Prediction.io - this is an open source machine learning server. It looks like they focus mainly on recommendations and you can build and fine tune your own models
Yhat - build and deploy models with R and Python
BigML - this has a user friendly interface and great visualizations for non-techies. You also have the choice to modify and fine tune your models and can solve both classification and regression problems here
wise.io - they seem to have a wider variety of problems they can tackle. They also have their own optimized Random Forest implementation that showed some impressive stats when benchmarked against R, Weka and Scikit-Learn
Precog - another strong contender in the space. They have a wider variety of type of input data - logs. JSON, NoSQL, etc. They were recently acquired, so their service may be shut down.
Ersatz - their service uses deep neural networks (black box). Looks like they're still in private beta
Prediction.io - this is an open source machine learning server. It looks like they focus mainly on recommendations and you can build and fine tune your own models
Yhat - build and deploy models with R and Python
BigML - this has a user friendly interface and great visualizations for non-techies. You also have the choice to modify and fine tune your models and can solve both classification and regression problems here
wise.io - they seem to have a wider variety of problems they can tackle. They also have their own optimized Random Forest implementation that showed some impressive stats when benchmarked against R, Weka and Scikit-Learn
Precog - another strong contender in the space. They have a wider variety of type of input data - logs. JSON, NoSQL, etc. They were recently acquired, so their service may be shut down.
Ersatz - their service uses deep neural networks (black box). Looks like they're still in private beta
Tuesday, August 13, 2013
Some Interesting links. Hyperloop, Google n-grams, PredPol
Finally, Elon Musk unveiled some details about the Hyperloop transport system. It would be quite interesting if this makes it out of conception and actually gets built. Right now, California is on the verge of spending more than 10x of what it would cost to build the Hyperloop system, to build one of the slowest high-speed rail systems in the world. A nice infograph of the Hyperloop Transport System
A very detailed Data Mining Map
An interesting visual mashup showing the Start-up Universe This mashup shows everything you'd want to know including company details, funding, VC's, rounds, etc. The data for this mashup is from the CrunchBase API
I recently came across Google's N-gram viewer.It graphs yearly counts of n-grams over the past 200 years. You could literally see when people started using "Donut" over "Doughnuts" link The rise of "Donut" starts at around the same time breakfast chains like Dunkin' Donuts were founded
The Atlas learning environment from O'Reilly. You could read a bunch of tech books both in early release and published.
Predpol, a system that helps predict crime in real time. They claim to place police officers at the right time and place, giving them the best chance to prevent crimes. The systems analyses historical crime data and assigns probabilities of future events / crimes to regions of space and time. This is probably sounding like Tom Cruises' sci-fi thriller, The Minority Report, but without psychics and bathtubs. The system predicts the 'when' and the 'where' of a crime but not the whom. I would not be surprised if the 'whom' can be predicted in the near future. PredPol was designed by scientists at UCLA, Santa Clara, UCI
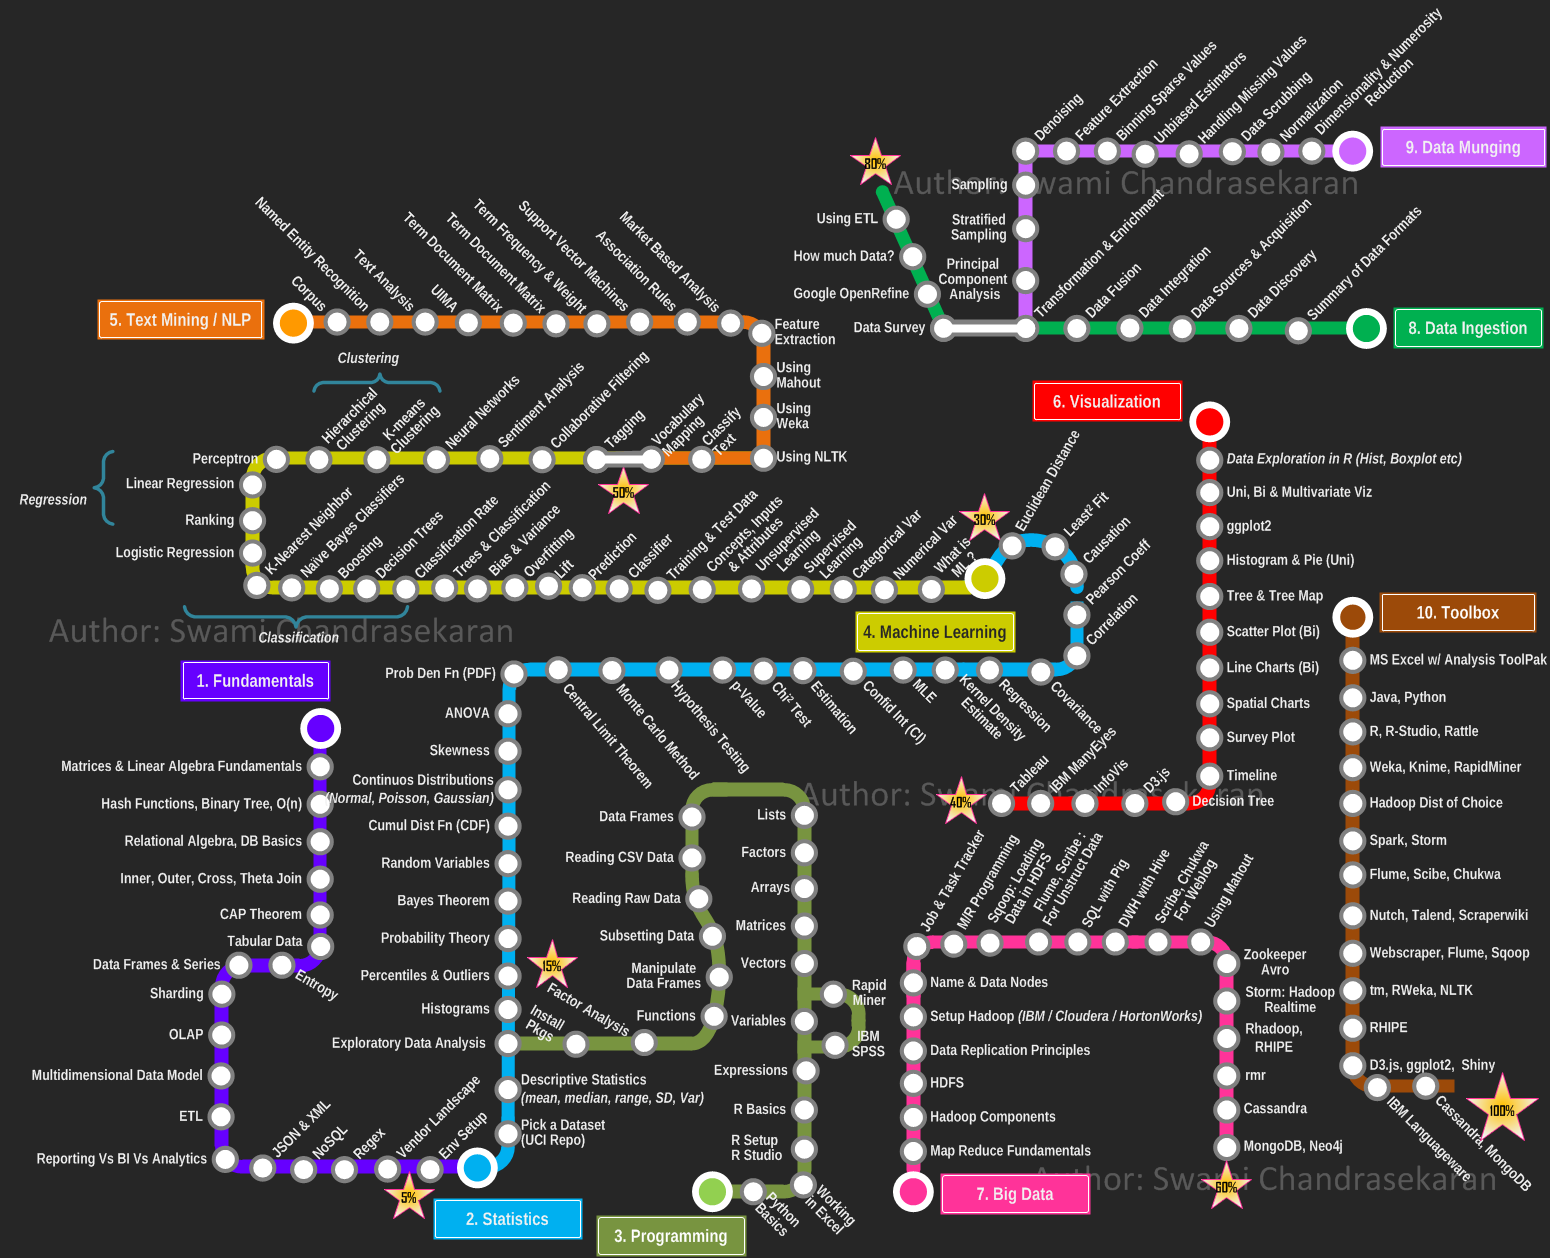
And finally, the road to becoming a Data Scientist can be a long and winding one, Swami Chandrasekaran's take on the Data Science Curriculum
A very detailed Data Mining Map
An interesting visual mashup showing the Start-up Universe This mashup shows everything you'd want to know including company details, funding, VC's, rounds, etc. The data for this mashup is from the CrunchBase API
I recently came across Google's N-gram viewer.It graphs yearly counts of n-grams over the past 200 years. You could literally see when people started using "Donut" over "Doughnuts" link The rise of "Donut" starts at around the same time breakfast chains like Dunkin' Donuts were founded
The Atlas learning environment from O'Reilly. You could read a bunch of tech books both in early release and published.
Predpol, a system that helps predict crime in real time. They claim to place police officers at the right time and place, giving them the best chance to prevent crimes. The systems analyses historical crime data and assigns probabilities of future events / crimes to regions of space and time. This is probably sounding like Tom Cruises' sci-fi thriller, The Minority Report, but without psychics and bathtubs. The system predicts the 'when' and the 'where' of a crime but not the whom. I would not be surprised if the 'whom' can be predicted in the near future. PredPol was designed by scientists at UCLA, Santa Clara, UCI
And finally, the road to becoming a Data Scientist can be a long and winding one, Swami Chandrasekaran's take on the Data Science Curriculum
Tuesday, December 18, 2012
Some Interesting Videos / Talks
Interesting talk by Jeff Hammerbacher on some of the things he's doing with Data Science in Healthcare / Genomics
I have recently become a huge fan of Nate Silver and Statistical Bayesian Inference. He recently gave a talk at Google
Subscribe to:
Posts (Atom)