Showing posts with label Estimating the value of pi. Show all posts

Saturday, March 14, 2015

In honor of Pi Day : Estimating the value of pi via Buffon's Needle

Last year we estimated the value of $\pi$ via Monte Carlo simulation. This year, we'll be revisiting the same exercise but using a different approach : Buffon's Needle. This approach is actually one of the oldest geometrical probability problems and it involves dropping needles on a lined sheet of paper and calculating the probability of the needles crossing lines in the page. This technique was first used by 18th century mathematician Georges-Louis Leclerc, Comte de Buffon.

In this scenario, we'll be dropping a bunch of randomly generated needles of length 1 on a grid with vertical lines. The spacing between the vertical lines is also of length 1. It turns out that you can estimate the value of $\pi$ by taking the fraction of the number of needles you dropped (Drops) and those that crossed any of the vertical lines (Hits) and multiplying by twice the length of a needle. See this ipython notebook for code used.

The following two graphs show our grid with 100 and 1000 randomly generated needles respectively


Let's work through the math:

$ 2 \times needlelength \times  \frac{Drops}{Hits}  \approx   \pi  $

where length of needle is 1 and the length of the spacing between the vertical grid lines is also 1

The graphs below were generated from a few hundred trials. For each trial, we increased the number of randomly generated needles. We can see the estimated value of  $\pi$ is about 3.12 which is a bit off from the true value of 3.14. I suspect there might be something going on with how the random needle center coordinates are generated since the needle graphs above are showing some symmetry. Regardless, we are still within 1% of the true value of $\pi$.


It's actually pretty cool to see how the value of $\pi$ sneaks out from the woodwork. There's probably a more intuitive way to explain how $\pi$ shows up in places we least expect

For all the code used for this analysis, visit this ipython notebook


Friday, March 14, 2014

In honor of Pi Day : Estimating the value of pi via Monte Carlo simulation

In honor of $\pi$ day, I'll run you through calculating the numerical value of $\pi$ using a method called Monte Carlo simulation. It is basically a type of simulation that samples a lot random values from a distribution. It is used widely to solve many types of problems including those that don't have closed form solutions like estimating the value of numerical integrals, sensitivity analysis, bayesian inference, predicting election results, stock price movements and the list goes on ...

In our scenario, we want to calculate the value of $\pi$. To do this, we''ll be throwing darts at a square dart board (dimensions : 1 by 1) with a quadrant (radius : 1) in it. After throwing a bunch of darts at the board, we'll find the ratio of the number of darts that end up inside the quadrant to the total number of darts we threw and then multiply that number by 4 to get an estimate for the value of $\pi$

Lets work through the math

$4 \times \frac{A_{quadrant}}{A_{square}} = 4 \times \frac{\frac{1}{4}\pi r^{2}}{(1)^2} = 4 \times \frac{\frac{1}{4}\pi(1)^2}{(1)^2} = 4 \times \frac{\frac{1}{4}\pi}{1} \approx  \frac{N_{hits}}{N_{trials}}  \approx   \pi  $

In our Monte Carlo simulation, we'll be sampling random points onto our 1 by 1 space and comparing the number of points that end up in the quadrant to the total number of points.


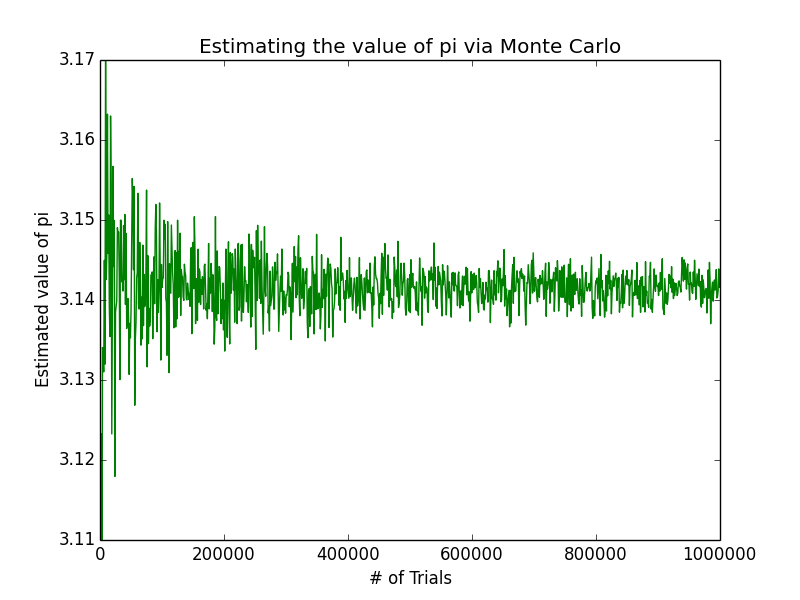
From the code sample above and my cli, we see that as we increase the number of trials, our estimated value of $\pi$ gets closer to the real value. And if you run enough trials you will approach steady state (true value). Another version of the code sample runs a lot of trials, so you can visually see what's happening to the estimated value of  $\pi$

See the graph below. The peaks occur between 3.140 and 3.144, which tells us that the true value of $\pi$ lies somewhere in that range